Drought Situation Report - July 31, 2006
More drought information resources are found at http://climate.umn.edu/doc/journal/dry_summer_2006.htm.

Weather last week:
Rainfall last week (map on right) was focused along a 60-mile wide band extending from Moorhead
to Duluth. One or more inches of rain fell in these areas. Two or more inches of rain fell in southern Itasca, northern Aitkin,
southern St. Louis, southern Lake, Carlton, and northern Pine counties. The rain helped to slow the rapidly deteriorating conditions
in these areas. Some areas receiving two or more inches of rain saw a rise in stream discharge values. Temperatures across the
state over the last seven days were extremely hot. Temperatures topped normal by six to nine degrees in most places. Many
communities reached the 100 degree mark at least once over the period from July 28 to July 31.
Seasonal weather overview:
Dryness has been entrenched in Minnesota for eleven weeks. Large-scale, precipitation-producing weather systems have been absent
since mid-May. The timing of the dry weather has been most unfortunate. The period from mid-May through early-September is historically
the wettest time of the year. Long-term average rainfall rates during this time interval are around one inch per week.
Very dry weather occurring during a time of year when ample rain is typical, leads to the rapid onset of drought. The precipitation
shortfalls have led to deteriorating crop conditions, low stream flows, and wildfires.
Drought status:
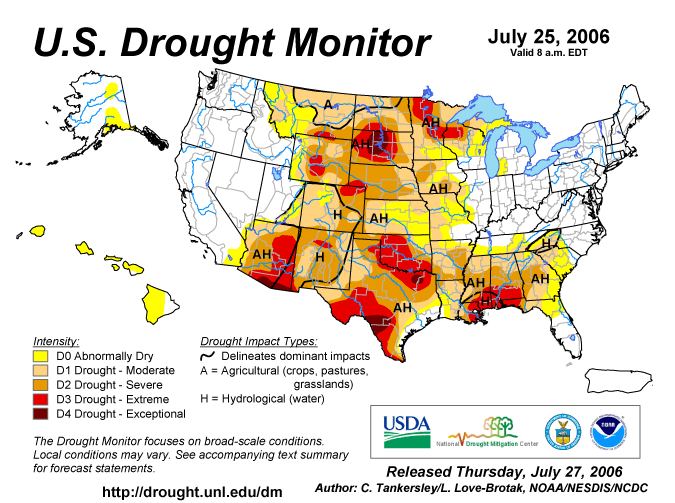
The latest National Drought Mitigation Center Drought Monitor, released Thursday, July 27, places northwestern, central, and east central
Minnesota in the Extreme Drought category. The situation transitions to a Severe Drought
category surrounding the Extreme Drought polygon. All other Minnesota locations, with the exception of south central and southeast Minnesota, are depicted in the Moderate Drought
classification. South central and southeast Minnesota are depicted as Abnormally Dry. Possible impacts for
landscapes depicted as experiencing Extreme Drought include: major crop/pasture losses; widespread water shortages or
restrictions. Possible impacts for landscapes depicted as experiencing Severe Drought include: crop or pasture losses likely;
water shortages common; water restrictions imposed. Possible impacts for landscapes depicted as experiencing Moderate Drought
include: some damage to crops, pastures; streams, reservoirs, or wells low, some water shortages developing or imminent;
voluntary water-use restrictions requested. The next Drought Monitor will be released on Thursday, August 3.
Without significant, wide-spread rain, many areas of Minnesota will either maintain or experience worsening drought conditions.
See: 12-Week Drought Progression Animation.
Sector briefs:
Agriculture - The
Agricultural Statistics Service reports that topsoil moisture for 85% of Minnesota's landscape is now "Short" or "Very Short".
This is a 10% increase from the previous week. Pasture conditions and alfalfa production continue to be significantly
impacted by the dry conditions. A surprisingly high percentage (around 50%) of Minnesota's major row crops (corn and soybeans) are rated
in good to excellent condition.
Stream flow - Stream discharge in over one half of Minnesota's rivers and streams falls below the 25th percentile
when compared with historical data for this time of year. Flow conditions
in many northern, central, and eastern Minnesota watersheds have dropped below the
Protected Flow threshold (lowest 10th percentile), leading the Department of Natural Resources to suspend surface water appropriation permits in these areas.
Public water supply - Many Minnesota communities
are imposing watering restrictions or outright watering bans.
Wildfire - Wildfire danger is
"High" or "Very High" in many Minnesota counties.
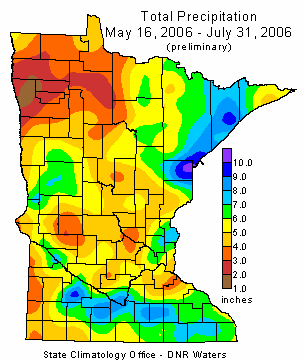
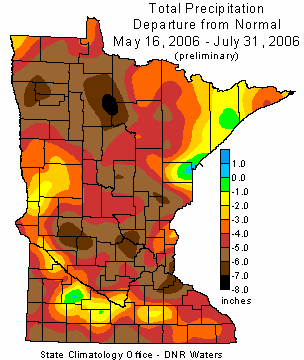
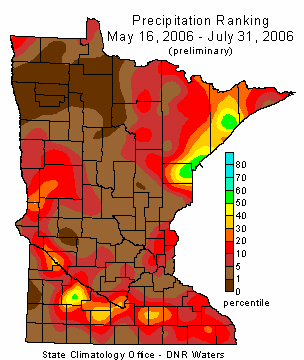
Eleven-week precipitation totals, departure, and ranking:
Rainfall totals over the past eleven weeks (May 16 - July 31) were less than five inches in many counties and less than four inches across much of
northwestern Minnesota. Eleven-week rainfall totals deviated negatively from historical averages by more than four inches in most
areas. Rainfall deficits exceeded five inches in many Minnesota communities. When compared with other May 16 to July 31 rainfall
totals in the historical database, this year's rainfall totals for the period rank among the lowest on record
in some locales. The situation is especially acute in northwest and north central Minnesota where near-record low precipitation totals are common across
a multi-county area.
Previous Drought Situation Report (July 27)
Previous Drought Situation Report (July 26)
Previous Drought Situation Report (July 21)
Previous Drought Situation Report (July 11)
More drought information resources are found at http://climate.umn.edu/doc/journal/dry_summer_2006.htm.

 Return to Minnesota Climatology Working Group Main page
Error processing SSI file
URL: http://climate.umn.edu/doc/journal/drought_situation_report_2006_060731.htm
Last modified: July 31, 2006
|