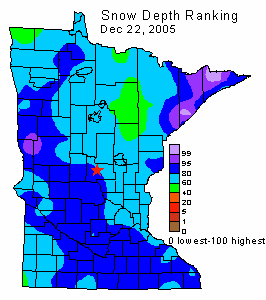
The Minnesota State Climatology Office makes extensive use of "ranking" maps when depicting precipitation totals and snow depths. A ranking map (also known as a "percentile" map) compares an observed meteorological condition with conditions reported throughout the long-term climate record. This allows the condition to be described using historical context. A location ranked at zero means that the condition is the lowest found in the historical record; a ranking of 100 indicates the highest on record. A ranking at the 50th percentile (also known as the "median") specifies that the observed condition is in the middle of the historical distribution; with half of all years in the past exceeding the current condition, and half of all years falling below the current condition.
 Snow depth ranking map example:
In the ranking map example shown at right, the December 22, 2005 snow depth for Little Falls (marked with red star)
is ranked at the 80th percentile. The Little Falls snow depth was 8 inches on December 22, 2005 (not shown on
this map). The 8-inch snow depth is compared with all other December 22 snow depth reports in the historical
climate record for Little Falls. The snow depths are sorted from lowest to highest (see example table below). In this example, assume that there
are 100 years of December 22 snow depth data available from Little Falls, and that the 2005 value matched
the 80th highest in the sort order. Therefore, the 2005 value ranked at the 80th percentile; 80 of the
December 22 snow depths were less than or equal to 8 inches, and 20 of the December 22 snow depths were
greater than or equal to 8 inches. Therefore, Little Falls is depicted on the map as ranking at the 80th
percentile.
Little Falls Snow Depths - December 22
Example data table (snow depth in inches)
year  depth  rank
----  -----  ----
1968   23.0   100 (highest)
.
1995   15.0    90 (90% lower - 10% higher)
.
2005    8.0    80 (80% lower - 20% higher)
.
1957    3.5    50 ("median" (50% above, 50% below)
.
1980    1.0    10 (10% lower - 90% higher)
.
2004    0.0     1 (lowest)
 Return to Minnesota Climatology Working Group Main Page
Error processing SSI file
URL: http://climate.umn.edu/doc/misc/ranking_maps_explained.htm
Last modified: December 22, 2005